Preface
- You require a cheap monitoring solution that is cloud agnostic.
Problem
- Google’s manged prometheus costs a lot; so self hosting prometheus+thanos to get around it.
- As the required metrics to properly observe our application increases, the requirement to selfhost the monitoring platform to curb the cloud costs makes more sense, rather than using managed monitoring service.
- This opens up self hosting and maintaining Prometheus+Thanos+GCS stack for all the internal observability needs.
- low cost of GCS + infrequent access to older metrics data makes Thanos’s requirement more sensible.
The Solution
- Store less data in prometheus’s tsdb while maintaining historical data in gcs for low cost query.
- Setup proper retention period as business requirement to reduce the latency of metrics query.
Prometheus
- A stable and mature TSDB, designed to record and host application metrics.
- Pros:
- Easy to get started with grafana for basic monitoring needs.
- Low barrier to entry if the requirement is not high availability.
- Cons:
- Hard to scale if HA is explicity required.
- Multiple Prometheus instances work independently, it does not have built in feature for master-slave replication and HA deployment like postgres and other stateful applications.
Thanos
- Solution built on top of Prometheus to solve HA and scalibility needs.
- Requires active connection to Prometheus instance to function.
- Manages multiple Prometheus instances and handles deduplication, downsampling and other higher order features that Prometheus does not support natively.
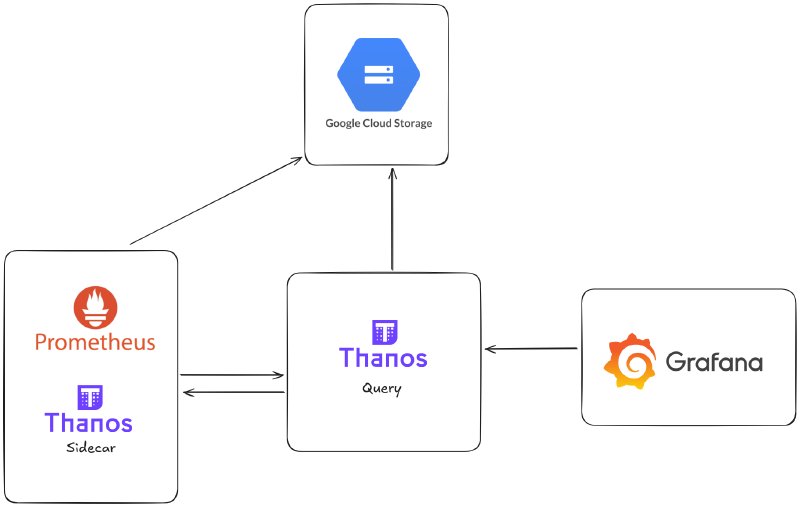
High level proposed architecture
- Store as less of data as required in memory in the prometheus instances.
- Configure thanos side car to upload metric data as frequent as possible to gcs or other colder storage as compared to tsdb for low memory and cluster resource requirement.
Possible issues with this approach
- Chatty communication between monitoring components might incur higher networking bills for multi-region k8s clusters.
- Needs manual security considerations to secure grafana and other public endpoints.
- Might take up engineering bandwidth: requiring more engineers to maintain it in the long term.
Installation
- This uses helm-charts by bitnami for thanos and the official Prometheus community maintained helm chart.
- Optimized values for helm install of our specific use case:
- Chart used: kube_prometheus_stack and bitnami_thanos_chart.
- Image tags are latest as per the period of this article.
- Notes
- Some names like the service endpoints might be changed as per the updation of helm chart and your release names.
- This is before bitnami announced its paid offerings.
| |
| |
Final notes and recommendations
- Setup proper alerting for failed compactors and other important metrics like consistent storage-gateway cache misses.
- Use proper memory requirements for storage gateway and querier for faster queries as business requirements.
- This setup does not factor in the cardinality constraints of your specific usecase.
- You might be a startup just starting with low enough unique users or a B2B product with low enough user-base that can get away with taking in user-id as a label in prom-metrics, but this might blow up your prom instance if your userbase is large enough.
- Keep monitoring the resource usage and latency of thanos and prom components for few days/weeks for resource exhaustion and your needs. If your prom starts getting OOM failures, you might need to reconfigure this setup to use remote-write instead of sidecar based pattern.
- Remote-Write is a little complicated but is a good trade-off if you have a quite a few components that queries for latest metrics and have enough engineering bandwidth to maintain it in the long term.
- Use a separate Node pool for monitoring components like prometheus and stateful components like databases and distributed caches for resource isolation and to reduce failure domains.